
A Leaderboard To Monitor OpenClaw Variants Performance
ClawCharts tracks the explosive Claw ecosystem in real time, ranking nine projects by stars, commits, and contributor momentum.

OpenClaw went from zero to 314,000 GitHub stars in under four months. It surpassed React. It surpassed Linux. It became the most-starred non-aggregator software project on GitHub, period.
But OpenClaw is no longer alone.
In the eight weeks since it exploded, the “Claw” ecosystem has spawned at least nine serious open-source AI agent projects, each attacking a different slice of the problem. Rust rewrites. Go ports for $10 hardware. Container-isolated forks built specifically to fix OpenClaw’s security nightmares.
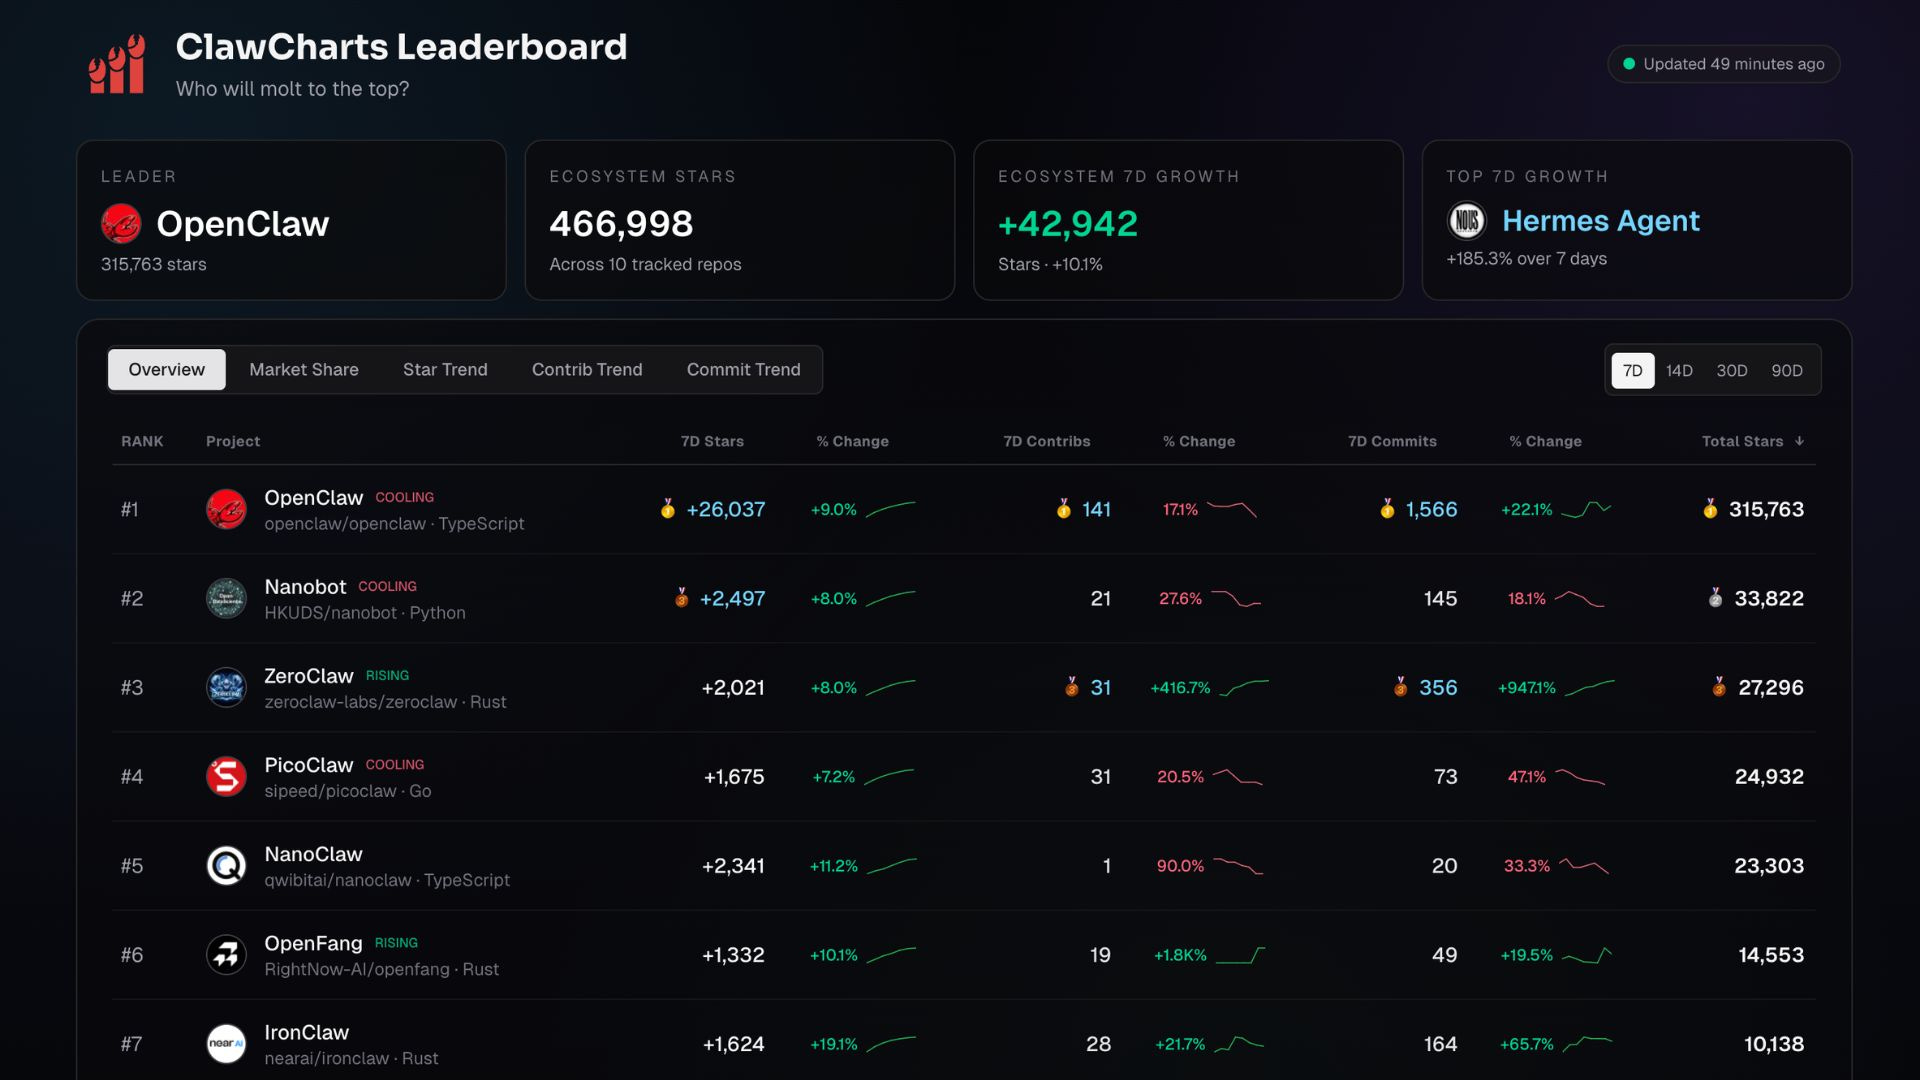
Now there’s a live scoreboard tracking the whole thing. ClawCharts is a free, real-time analytics dashboard that ranks every major Claw project by star growth, contributor activity, and commit velocity.
What Is ClawCharts?
ClawCharts pulls live data from the GitHub API and ranks projects using a composite momentum score. The primary drivers are seven-day stars gained (plus percentage change), seven-day contributors (plus percentage change), and seven-day commits (plus percentage change). Total stars serve as a tiebreaker.
This is what the dashboard looks like:
Keep reading with a 7-day free trial
Subscribe to Generative AI Publication to keep reading this post and get 7 days of free access to the full post archives.